Canvas
介绍
canvas 是绘制图形的。
canvas 是一个二维网格。左上角坐标为 (0,0)
首先创建一个画布
<canvas id="cvs" width="1000" height="800"></canvas>然后获取到画布和二维模型
let canvas = document.getElementById('cvs')
let ctx = canvas.getContext('2d')
ctx 就相当于画笔了
检查支持性
let canvas = document.getElementById('cvs')
if (canvas.getContext) {
  // 支持canvas
} else {
  // 不支持canvas
}
大小
canvas 默认大小是宽度 300px,高度 150px。不能设置百分比,不能通过 css 设置宽高
方式一、直接设置 width 和 height 属性
<canvas id="cvs" width="1000" height="800"></canvas>方式二、通过 js 设置
let canvas = document.getElementById('cvs')
let ctx = canvas.getContext('2d')
ctx.width = 1000 // 可以不写单位px
ctx.height = 800
如果想动态设置宽高,比如想让 canvas 的宽度占据屏幕的 70%,根据16:9的比例计算高度
const canvasWidth = window.innerWidth * 0.7
const canvasHeight = (canvasWidth * 9) / 16

ctx.width = canvasWidth
ctx.height = canvasHeight
线
ctx.moveTo(10, 20) // 定义起点
ctx.lineTo(50, 100) // 定义终点
ctx.strokeStyle = '#f00' // 线的颜色
ctx.stroke() // 画线注意设置样式要在绘制之前,否则无效
画个树:
ctx.beginPath()
ctx.moveTo(500, 50)
ctx.lineTo(300, 200)
ctx.lineTo(450, 200)
ctx.lineTo(200, 300)
ctx.lineTo(450, 300)
ctx.lineTo(450, 400)
ctx.lineTo(550, 400)
ctx.lineTo(550, 300)
ctx.lineTo(770, 300)
ctx.lineTo(550, 200)
ctx.lineTo(700, 200)
ctx.fillStyle = '#0f0'
ctx.fill()
ctx.strokeStyle = '#0f0'
ctx.stroke()
ctx.closePath()
电子画笔
let canvas = document.getElementById('canvas')
let ctx = canvas.getContext('2d')
let drawStatus = false
canvas.onmousedown = (e) => {
  ctx.moveTo(e.offsetX, e.offsetY)
  drawStatus = true
}
canvas.onmouseup = () => (drawStatus = false)
canvas.onmouseout = () => {
  if (drawStatus) {
    drawStatus = false
  }
}
canvas.onmousemove = (e) => {
  if (drawStatus) {
    ctx.lineTo(e.offsetX, e.offsetY)
    ctx.stroke()
  }
}
二次贝塞尔曲线
二次贝塞尔曲线有一个开始点、一个结束点以及一个控制点
quadraticCurveTo(cp1x, cp1y, x, y) // cp1x,cp1y为一个控制点,x,y为结束点示例:对钩
ctx.beginPath()
ctx.moveTo(500, 400) // 如果不设置,那么起始点位置就在控制点,视觉上就是绘制了一条直线
ctx.quadraticCurveTo(500, 600, 900, 400)
ctx.stroke()
ctx.closePath()
三次贝塞尔曲线
三次贝塞尔曲线有两个控制点
bezierCurveTo(cp1x, cp1y, cp2x, cp2y, x, y) // cp1x,cp1y为控制点一,cp2x,cp2y为控制点二,x,y为结束点示例:红色爱心
ctx.beginPath()
ctx.moveTo(75, 40)
ctx.bezierCurveTo(75, 37, 70, 25, 50, 25)
ctx.bezierCurveTo(20, 25, 20, 62.5, 20, 62.5)
ctx.bezierCurveTo(20, 80, 40, 102, 75, 120)
ctx.bezierCurveTo(110, 102, 130, 80, 130, 62.5)
ctx.bezierCurveTo(130, 62.5, 130, 25, 100, 25)
ctx.bezierCurveTo(85, 25, 75, 37, 75, 40)
ctx.fillStyle = '#f00'
ctx.fill()
路径
ctx.beginPath()

ctx.closePath()
如果要绘制多个图形,需要声明开始和结束路径,否则图形会相互干扰,影响结果。
- 使用
fill()时,路径自动闭合,可以不用closePath()。 - 使用
stroke()时,不会闭合路径,如果没有closePath(),则只绘制了两条线段,不是完整的三角形
矩形
fillRect(x, y, width, height)绘制填充的矩形strokeRect(x, y, width, height)绘制矩形的边框clearRect(x, y, width, height)清除指定矩形区域
ctx.beginPath()
ctx.fillStyle = '#eee'
ctx.fillRect(50, 400, 200, 100)
ctx.clearRect(60, 420, 180, 60) // 在内部擦除一个矩形
ctx.strokeStyle = '#666'
ctx.strokeRect(140, 430, 30, 30)
ctx.closePath()ctx.fillRect(50,400,200,100)表示矩形左上角坐标为(50,400),宽 200px,高 100px
圆
arc(x, y, radius, startAngle, endAngle, anticlockwise)参数分别表示圆心坐标,半径,起始弧度,结束弧度,绘制方向
ctx.arc(100, 100, 50, 0, 2 * Math.PI, false)
ctx.fillStyle = '#f00'
ctx.fill() // 填充
角度与弧度的 js 表达式:
弧度 = (Math.PI/180) * 角度anticlockwise 为 true,则按逆时针绘制,false 按顺时针绘制,默认为 false
数学中的角度逆时针为正,而这里的起止角是以顺时针为正。当起角设为 0 度,止角设为 120 度时,会从右边水平位置向下旋转 120 度。
文字
ctx.beginPath()
ctx.font = '100px 微软雅黑' // 字体大小和类型
ctx.strokeStyle = 'gold'
ctx.strokeText('hello world !', 800, 200)
ctx.fillStyle = '#00f'
ctx.fillText('canvas', 800, 400) // 文字和位置
ctx.closePath()
阴影
ctx.beginPath()
ctx.fillStyle = '#000'
ctx.shadowOffsetX = 10
ctx.shadowOffsetY = 10
ctx.shadowColor = 'gold'
ctx.shadowBlur = 5
ctx.fillRect(600, 400, 200, 200)
ctx.closePath()shadowOffsetX、shadowOffsetY表示阴影横、纵向偏移量,shadowColor表示阴影颜色,shadowBlur表示模糊等级。
渐变
线性渐变
createLinearGradient(x1,y1,x2,y2),参数表示起点和终点
addColorStop(x,y),x 表示偏移量(0~1),y 表示颜色
ctx.beginPath()
const color = ctx.createLinearGradient(0, 0, 0, 400)
color.addColorStop(0.3, '#E55D87')
color.addColorStop(0.5, '#ff0')
color.addColorStop(1, '#5FC3E4')
ctx.fillStyle = color
ctx.fillRect(500, 100, 300, 300)
ctx.closePath()
径向渐变
createRadialGradient(x1,y1,r1,x2,y2,r2),起始圆心、结束圆心和相关半径
ctx.beginPath()
ctx.arc(500, 300, 100, 0, 2 * Math.PI, true)
let color = ctx.createRadialGradient(500, 300, 30, 500, 300, 100)
color.addColorStop(0, 'red')
color.addColorStop(0.5, 'orange')
color.addColorStop(1, 'yellow')
ctx.fillStyle = color
ctx.fill()
ctx.closePath()
图片绘制
drawImage(image, x, y)
其中 image 是 image 或者 canvas 对象,x 和 y 是其在目标 canvas 里的起始坐标。
drawImage(image, x, y, width, height)
width 和 height,这两个参数用来控制 当向 canvas 画入时应该缩放的大小
drawImage(image, sx, sy, sWidth, sHeight, dx, dy, dWidth, dHeight)
image 是 image 或者 canvas 对象,前 4 个是定义图像源的切片位置和大小,后 4 个则是定义切片的目标显示位置和大小
function draw() {
  let ctx = document.getElementById('first-canvas').getContext('2d')
  let img = new Image()
  img.onload = function () {
    ctx.beginPath()
    ctx.drawImage(img, 0, 0)
    ctx.closePath()
  }
  img.src = './assets/images/green1.png'
}
draw()
移动
旋转
缩放
变形
裁剪
动画
可以用 window.setInterval(), window.setTimeout(),和 window.requestAnimationFrame()来设定定期执行一个指定函数。
示例:行走的绿巨人
<canvas id="first-canvas" width="2000" height="800"></canvas>
<div style="display: none;">
  <img src="./assets/images/green1.png" id="img1" alt="" />
</div>let firCanvas = document.getElementById('first-canvas')
let ctx = firCanvas.getContext('2d')
let img1 = document.getElementById('img1')
let X = 0
let countNum = 0
function picRun() {
ctx.clearRect(0, 0, 1200, 1000)
countNum++
if (countNum == 10) {
X += 129
countNum = 0
}
if (X >= 387) {
X = 0
}
ctx.beginPath()
ctx.drawImage(img1, X, 0, 129, 135, 100, 100, 129, 135)
ctx.closePath()
ctx.stroke()
}
window.setInterval(picRun, 30)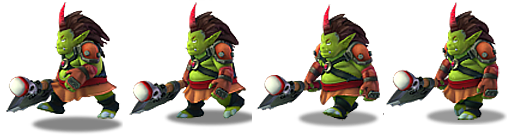
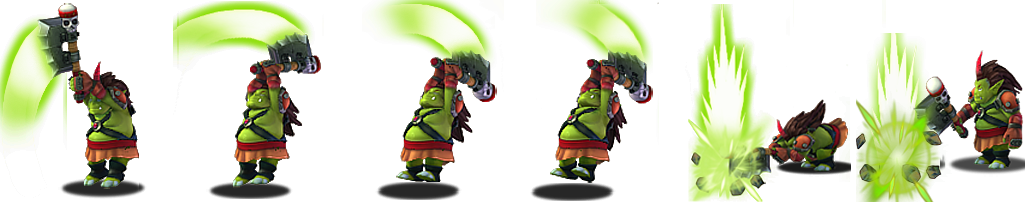
类似于精灵图切割图片,图片宽 515px,高 135px,每一个小图是四分之一即 129px,高度不用切。
clearRect()清除以前的图层,防止堆积覆盖
countNum 是计数器,控制图片的切换频率
300ms,当切割宽度到达 3 个巨人宽度时归零,重新切割。
图片矩形标注
场景
要在一张图片上可以画矩形标注,并将坐标传给后端,那么可以使用canvas,宽高和图片的宽高一样,完全覆盖在图片上。提交时的数据格式为[{left:1, top:2, width:3, height:4}]
思路:只要获取鼠标点击的起始点和抬起的结束点,绘制矩形,然后把 canvas 坐标和图片的实际坐标转换一下就可以了
<template>
  <div style="position: relative">
    <img id="myimg" :style="{ width: `${canvasWidth}px`, height: `${canvasHeight}px` }" src="img.png" alt="" />
    <canvas id="cvs" style="position: absolute; top: 0; left: 0; z-index: 1">当前浏览器不支持Canvas</canvas>
    <el-button type="primary" @click="resetLine">重置画线</el-button>
  </div>
</template>

<script>
export default {
  data() {
    return {
      canvasWidth: 900,
      canvasHeight: 500,
      ctx: null,
      historyLine: [],
      startPoint: [],
      lineList: [] // 要提交的点坐标
    }
  }
}
</script>
canvas 默认大小是宽度300px,高度150px。不能设置百分比,不能通过 css 设置宽高。可以直接设置width和height属性。如果想动态设置宽高,比如想让 canvas 的宽度占据屏幕的 70%,根据16:9的比例计算高度,可以使用 js 设置
this.canvasWidth = window.innerWidth * 0.7
this.canvasHeight = (canvasWidth * 9) / 16

const canvas = document.getElementById('cvs')
canvas.width = this.canvasWidth
canvas.height = this.canvasHeight
坐标转换
1、将屏幕坐标转化为 canvas 坐标
触发鼠标事件时,要将屏幕坐标转化为 canvas 坐标。即鼠标点击时,相对屏幕的位置要转换为相对 canvas 的位置
这段代码{ x: e.offsetX, y: e.offsetY, which: e.which }也可用下面的方法代替
getBoundingClientRect()提供了元素的大小及其相对于视口的位置
windowToCanvas(e, canvas) {
    const bbox = canvas.getBoundingClientRect()
    return {
        x: e.clientX - bbox.left * (canvas.width / bbox.width),
        y: e.clientY - bbox.top * (canvas.height / bbox.height),
        which: e.which // 左击 1  右击 3
    }
}
2、将 canvas 坐标转为图片坐标
function transform(point) {
  const x = point[0] / this.canvasWidth // 计算比例
  const y = point[1] / this.canvasHeight
  const elementImage = document.querySelector('#myimg')
  const originX = Math.round(elementImage.naturalWidth * x)
  const originY = Math.round(elementImage.naturalHeight * y)
  return [originX, originY]
}naturalWidth和naturalHeight是 h5 新增的属性,可以直接获取图片的原始宽高
关键代码
getImageData返回一个ImageData对象, 用来描述 canvas 区域隐含的像素数据
putImageData将数据从已有的ImageData对象绘制到位图
<script>
export default {
  methods: {
    drawLine() {
      let canvas = document.getElementById('cvs')
      canvas.width = this.canvasWidth
      canvas.height = this.canvasHeight
      let ctx = canvas.getContext('2d')
      ctx.strokeStyle = '#f00'
      this.ctx = ctx

      let dragging = false
      let startPoint = {}

      canvas.onmousedown = (e) => {
        e.preventDefault()
        startPoint = { x: e.offsetX, y: e.offsetY, which: e.which }
        dragging = true
        this.startPoint = this.transform([startPoint.x, startPoint.y])
      }

      canvas.onmousemove = (e) => {
        e.preventDefault()
        if (dragging) {
          this.showLastHistory() // 每次绘制先清除上一次
          this.updateRect({ x: e.offsetX, y: e.offsetY, which: e.which }, startPoint)
        }
      }

      this.addHistoy(canvas.width, canvas.height) // 添加一个默认的数据

      canvas.onmouseup = (e) => {
        e.preventDefault()
        dragging = false
        this.addHistoy(canvas.width, canvas.height) // 保存上一次数据

        const endP = { x: e.offsetX, y: e.offsetY, which: e.which }
        const endPoint = this.transform([endP.x, endP.y])
        const obj = {
          left: this.startPoint[0],
          top: this.startPoint[1],
          width: Math.abs(this.startPoint[0] - endPoint[0]),
          height: Math.abs(this.startPoint[1] - endPoint[1])
        }
        this.lineList.push(obj)
      }
    },

    // 将canvas坐标转为图片坐标
    transform(point) {
      const x = point[0] / this.canvasWidth
      const y = point[1] / this.canvasHeight
      const elementImage = document.querySelector('#myimg')
      const originX = Math.round(elementImage.naturalWidth * x)
      const originY = Math.round(elementImage.naturalHeight * y)
      return [originX, originY]
    },

    // 重置画线
    resetLine() {
      if (this.historyLine.length > 1) {
        this.historyLine.pop()
        this.showLastHistory()
        this.lineList.pop()
      }
    },

    addHistoy(width, height) {
      this.historyLine.push({ data: this.ctx.getImageData(0, 0, width, height) })
    },
    showLastHistory() {
      this.ctx.putImageData(this.historyLine[this.historyLine.length - 1]['data'], 0, 0)
    },

    // 更新矩形
    updateRect(point, startPoint) {
      const w = Math.abs(point.x - startPoint.x)
      const h = Math.abs(point.y - startPoint.y)
      const left = point.x > startPoint.x ? startPoint.x : point.x
      const top = point.y > startPoint.y ? startPoint.y : point.y
      this.ctx.save()
      this.ctx.beginPath()
      this.ctx.rect(left, top, w, h)
      this.ctx.stroke()
      this.ctx.restore()
    }
  }
}
</script>